Interface Design

UX Logics

Dashboard

Dashboard

Energy Tool - Bill Analysis

Energy Tool - Bill Analysis

NewRa Grids -

Website Design

Role

Role

Lead UI/UX Designer (End-to-End)

Team

Team

Solo Designer, collaborating with Product Lead & 2 Full-stack Engineers

Timeline

Timeline

6 weeks

Platform

Platform

Web App / Desktop

Project Objective

Project Objective

I led the design of Bill Analysis Tool (NewRa Lens) with a focus on extracting the bill information in the most user friendly way. Working with limited time and resources, I introduced a structured design process and scalable design system that improved developer efficiency and gave stakeholders better visibility into the objective of the tool.

The purpose was to allows users to upload electricity bills and review a basic analytical overview of their electricity consumption and cost structure which will lead to to make better energy (electricity) demand and consumption decisions.

Impact

Impact

1

Reduced bill processing friction.

2

Improved developer handoff speed by 70%.

3

established the baseline UX for 11 downstream energy tools.

The Website

The website was the touchpoint through which the user lands on the OCR service. The below is a quick video which I worked on. I was responsible for information architecture, user journey, information hierarchy, responsive screens, component setup, design library, UI design and lastly collaboration with the developer.

Setting The Context

Setting The Context

The consumption intelligence tool is only one out of the 12 tools. It is for when the user clicks on "Analyze bill" on website to find out more about their consumption patterns and then decide what will be the best approach for them in order to save on energy consumption and maximise production. The tool expansion is work in progress.

The consumption intelligence tool is only one out of the 12 tools. It is for when the user clicks on "Analyze bill" on website to find out more about their consumption patterns and then decide what will be the best approach for them in order to save on energy consumption and maximise production. The tool expansion is work in progress.

This tool should answer -

This tool should answer -

  1. How is electricity consumed across time?

  1. What portion of the load occurs during peak periods?

  1. What is the baseline load profile for renewable matching?

  1. How stable or seasonal is the demand?

NewRa Grids is a renewable energy execution and coordination platform that enables structured participation between generators and consumers which governs allocation, delivery, settlement and accounting

~ Founder

The Process - Research, Ideation, Definition

The Process - Research, Ideation, Definition

The research required me to study the user base, competitors, documenting product progress. I Ideation required me to iterate and reiterate on the figjam, take reviews and coordinate with developers on what we is feasible to achieve. The definition required me to lock a user journey, task flow, information hierarchy and wireframing.

The research required me to study the user base, competitors, documenting product progress. I Ideation required me to iterate and reiterate on the figjam, take reviews and coordinate with developers on what we is feasible to achieve. The definition required me to lock a user journey, task flow, information hierarchy and wireframing.

Understanding the tool

stack flow

Understanding the tool

stack flow

The tool had to make sense with the co-relation of other tools and future prospects. So I tool a deep dive into making a flow for the entire ecosystem which covers-
1. Primary analysis (client + internal)

  1. Advance analysis (internal only)

The tool had to make sense with the co-relation of other tools and future prospects. So I tool a deep dive into making a flow for the entire ecosystem which covers-
1. Primary analysis (client + internal)

  1. Advance analysis (internal only)

This project focuses on primary analysis

This project focuses on primary analysis

Designing with clarity

Designing with clarity

I was provided with the tool stack and documents to know the overview of what the product does. As the solo designer in the team I conducted regular review meets, took feedbacks, understood tech support and limitations. I conducted user research, competitor analysis, UI logics and usability testing.

I was provided with the tool stack and documents to know the overview of what the product does. As the solo designer in the team I conducted regular review meets, took feedbacks, understood tech support and limitations. I conducted user research, competitor analysis, UI logics and usability testing.

Information Hierarchy

Information Hierarchy

Designed the information hierarchy in a way that the user can skim through important data points without getting overwhelmed.

Designed the information hierarchy in a way that the user can skim through important data points without getting overwhelmed.

UI elements & Component Library

UI elements & Component Library

Onboarding Flow

Onboarding Flow

Once the user engages in analysing the bill, the primary information is asked which transitions into a seamless upload bill screen. The existing flow had unorganised approach toward onboarding flow (avoidable CTAs at places, additional screen for first name & last name, no drop box for uploading the bill and more ). I streamlined the entire onboarding process of 10 screens to just 6 which make the user journey easier and faster.

Once the user engages in analysing the bill, the primary information is asked which transitions into a seamless upload bill screen. The existing flow had unorganised approach toward onboarding flow (avoidable CTAs at places, additional screen for first name & last name, no drop box for uploading the bill and more ). I streamlined the entire onboarding process of 10 screens to just 6 which make the user journey easier and faster.

Final User Interface

Final User Interface

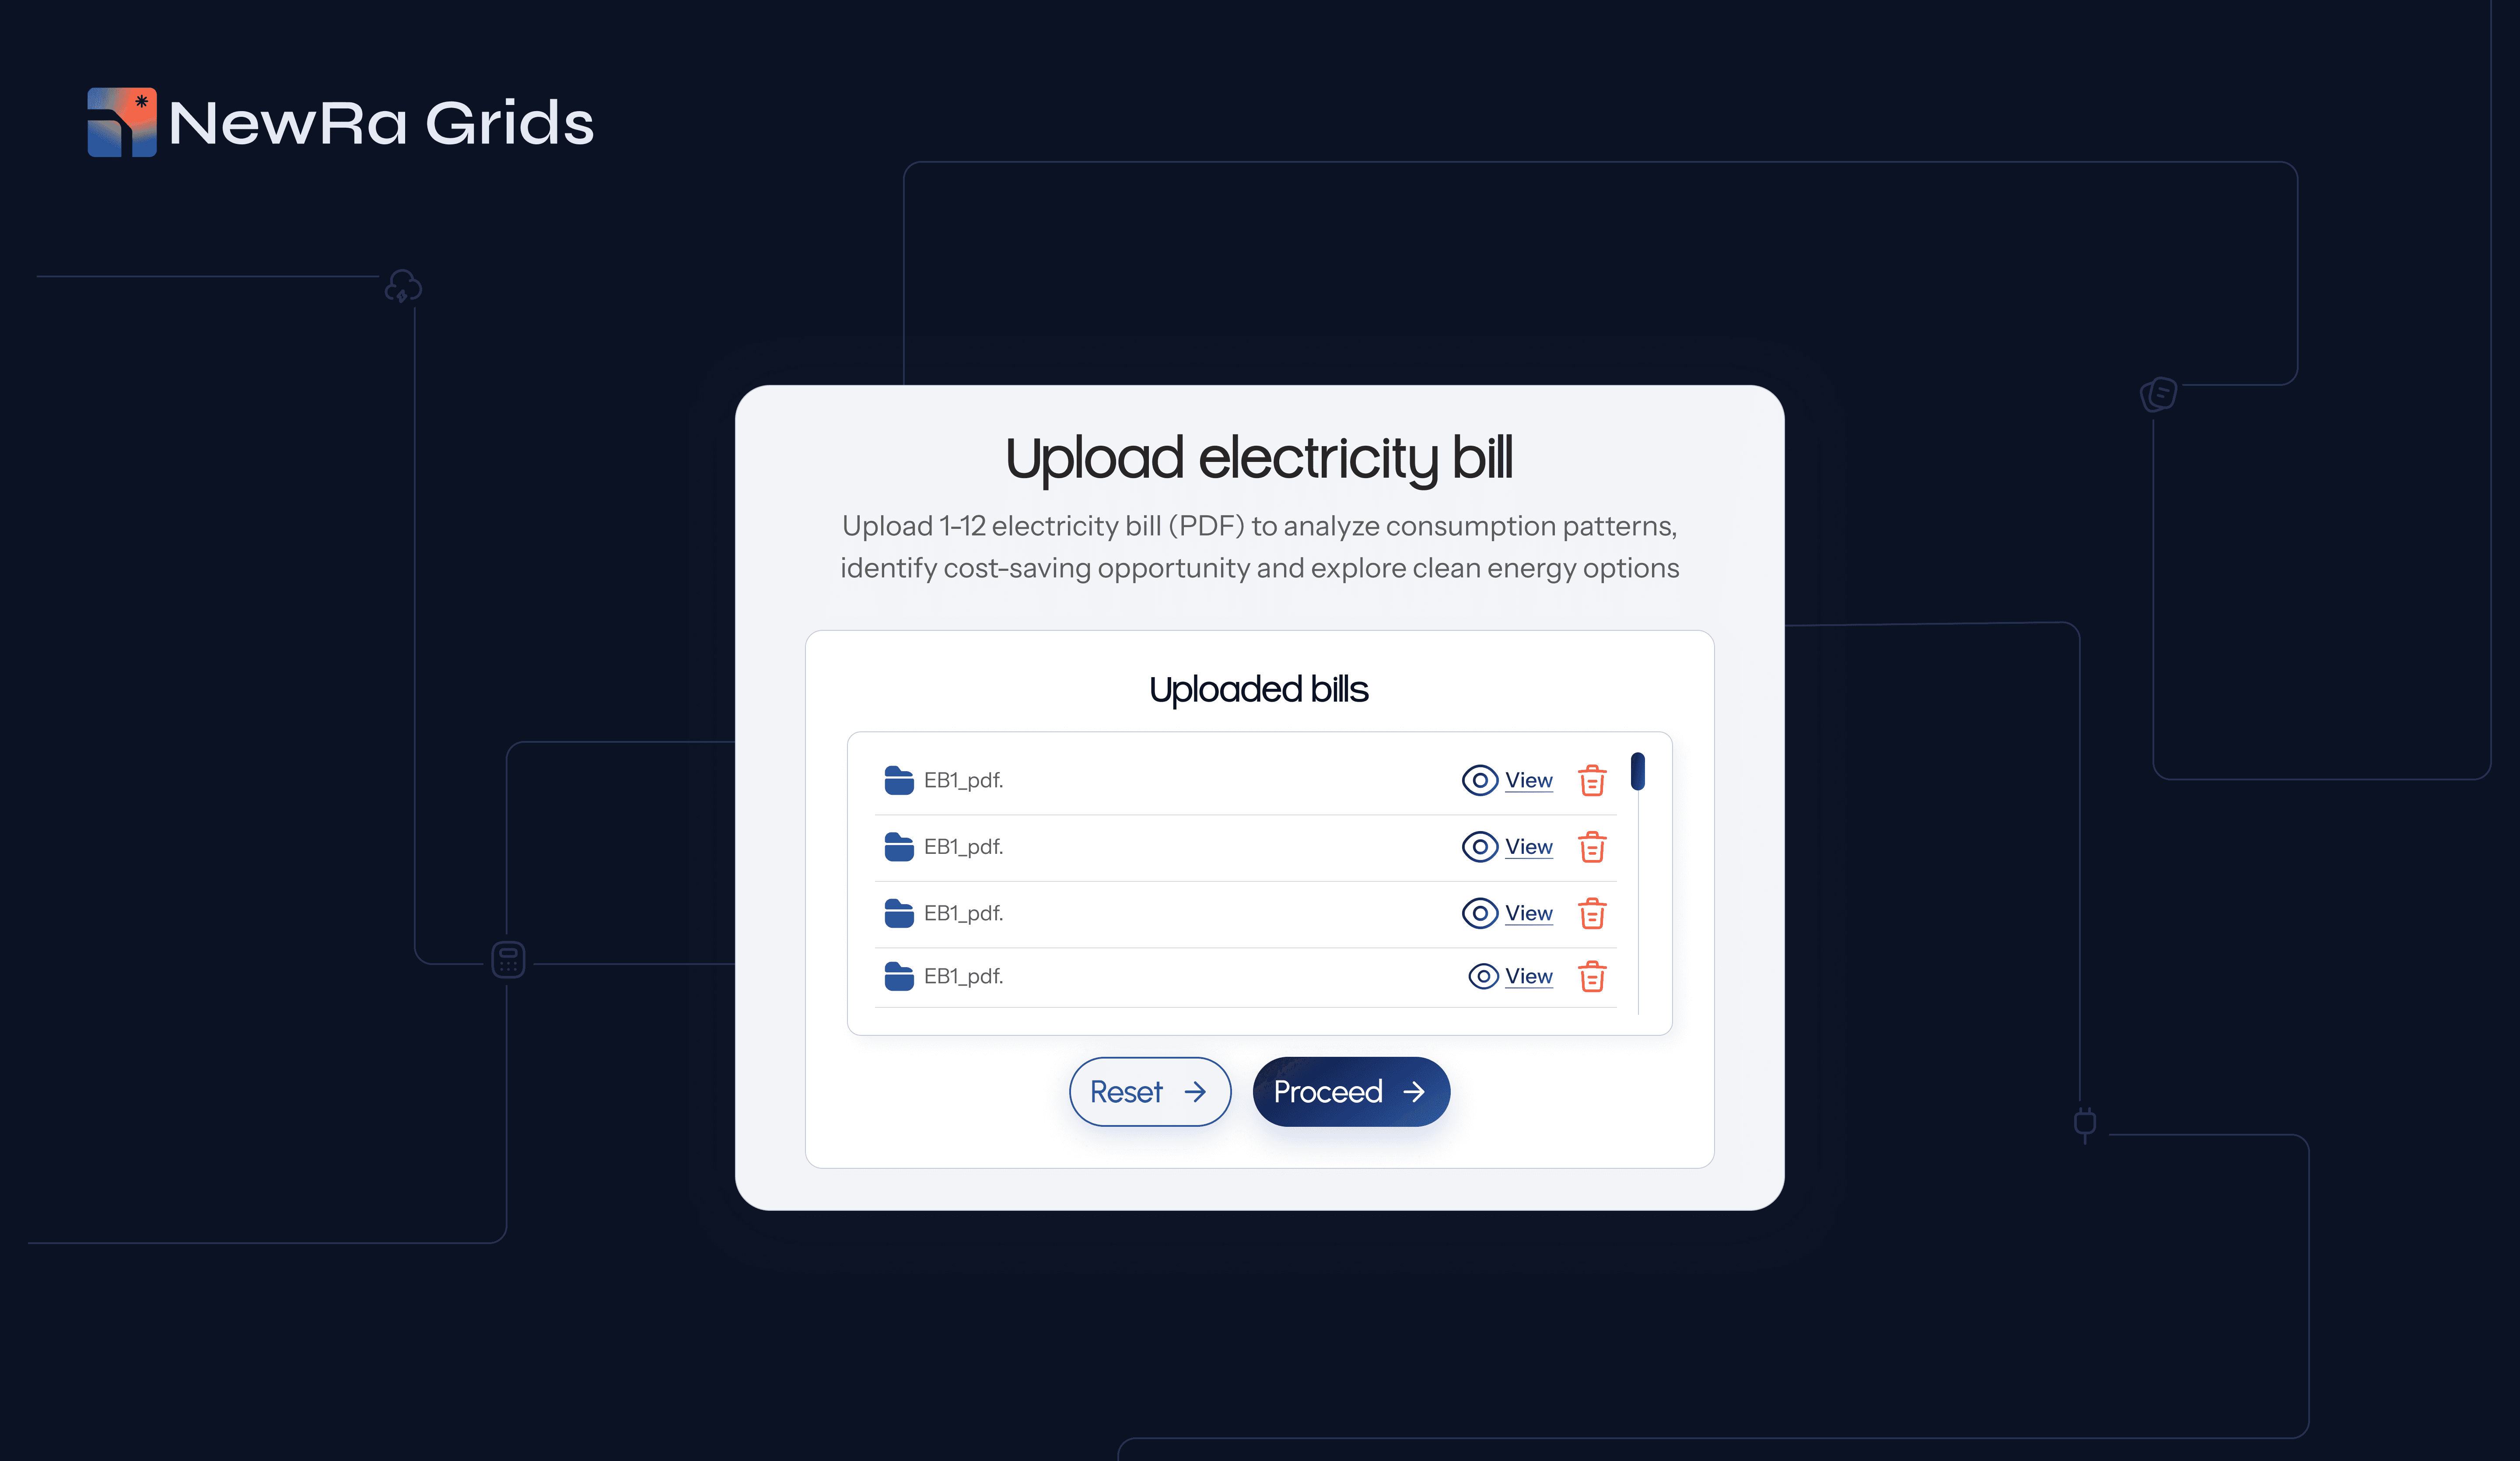
Bill Uploaded

Bill Uploaded

The previous version didn't allow the user to select all the bills and see what what bills are uploaded. I worked on the visuals in a way that the user can overlook the changing matrix as they select the bill that they wish to analyse.

The previous version didn't allow the user to select all the bills and see what what bills are uploaded. I worked on the visuals in a way that the user can overlook the changing matrix as they select the bill that they wish to analyse.

Division of information

Division of information

The graphs were overwhelming but that was the best way to give the user the visual review of their consumption patterns. I worked on an extensive component library to have a flexible interface and placement of information.

The graphs were overwhelming but that was the best way to give the user the visual review of their consumption patterns. I worked on an extensive component library to have a flexible interface and placement of information.

Introducing Toggle and Checkbox

Introducing Toggle and Checkbox

The previous version didn't allow the user to bifurcate between primary action and secondary action. I introduced a few visual elements like toggle and checkboxes for easier selection.

The previous version didn't allow the user to bifurcate between primary action and secondary action. I introduced a few visual elements like toggle and checkboxes for easier selection.

Division between Consumption & Finances

Division between Consumption & Finances

One of the UI element that worked well in the UI was the division between consumption and finances which allows the user to review the matrix in different units like MWh, kVAh, rupees.

One of the UI element that worked well in the UI was the division between consumption and finances which allows the user to review the matrix in different units like MWh, kVAh, rupees.

Profile and edit access

Profile and edit access

The profile screen allows the user to review the data and make changes like - edit, delete, reset, logout.

The profile screen allows the user to review the data and make changes like - edit, delete, reset, logout.

Key Learnings

Working with Claude

In this project, I got the opportunity to learning cluade and know the potential of the tool. I also learnt the limitations of it and balance out the best approach to reach to the best results

UI Feedbacks

There was an intense to and fro of feedbacks on each design iteration to polish the product further which made me patient and attentive towards my shortcomings.

Portfolio 2025

AVAILABLE FOR JOB

Portfolio 2025

AVAILABLE FOR JOB

Portfolio 2026

Available for new work

Create a free website with Framer, the website builder loved by startups, designers and agencies.